User's Guide for the FMT
Adding Earth Observation data
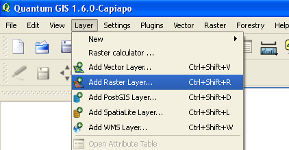 The first step in using the FMT is to add one or more layers of Earth Observation data to QGIS. Use the Layer, Add Raster Layer menu. This will bring up a file open dialog that allows a wide variety of GDAL-compatible raster files to be opened. Most commonly, the raster data is likely to be a GeoTiff with extension .TIF.
QGIS has a number of plugin tools for raster images. The most useful of these is the GDAL Tools plugin, which can be installed via the plugin menu. It gives a Raster option on the main menu, with the some 20 processing tools as sub-menus.
Defining Forest Management Units
The FMT requires that there is at least one vector layer representing the forest area of interest. This can be a simple outline, or more commonly will be a file representing Forest Management Units (FMUs). These are the basic areas defined in forest management planning, and depeing on local usage, may be called compartments, blocks, stands, etc. In plantations, FMUs are typically contiguous, monospecific, uniform-aged blocks, but in natural forest they can be quite diverse in composition.
As with rasters, there are many formats for vector files, but by far the most common is the shapefile format (.shp) originally developed by ESRI. QGIS supports the OGR library of vector formats, and has a variety of standard and plugin tools for manipulating and performing geoprocessing operations on them. It is recommended that FMT users enable the fTools plugin, which will give a Vector menu on the main menu bar to complement the Raster functions of the GDAL toolkit.
QGIS allows a forest outline, and simple FMUs to be defined directly on screen and saved as a vector (shape) file. Selecting Layer, New, New Shapefile layer allows a shape to be defined via the vector editing tools. When doing this, it is important to note that the topology should be selected as polygon, not point or line. Only vector files with polygon topology can be processed by the FMU for area calculation.
Setting up the Area Analysis Tool
 Having set at least two layers in QGIS, as follows:
- Earth Observation (EO) data: A raster file, usually GeoTiff, one band, with colour palette (representing a classified image).
- Forest Management Unit (FMU) data: A vector file, usually a shapefile, with polygon topology.
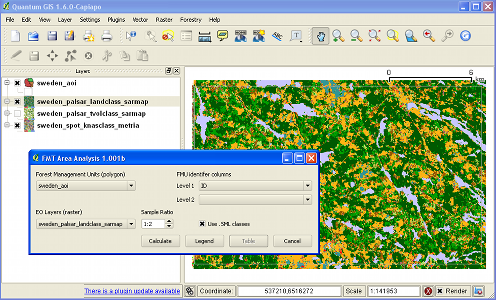
The FMT can be started by selecting Forestry, Forest Area Analysis from the QGIS menu. The illustration at the right shows an example with the test data supplied (see Download)
On this dialog, the drop-down menu headed Forest Management Units will list all loaded files which have polygon topology, and which can represent FMUs or an area of interest such as the outline of a forestry project. Similarly, the list headed EO Layers will list all loaded raster files which have a single band paletted colour system.
The drop-downs headed FMU identifier columns will be blank by default, and can be left blank for the simplest case. This will calculate total areas in each of the EO-defined classes within the total polygon area. A more typical case will be to calculate area by age classes, forest districts, or compartments. The drop-downs will list all attributes given in the selected FMU file, and can use one or two of them to define the totalling category.
The Sample Ratio provides a trade off between time and accuracy. Processing time is proportional to the (sampling ratio)², so a ratio of 1:2 requires ¼ of the time, but results will not be exact compared with 1:1 sampling (though the area estimation error will typically be very small). A recommendation is to use a lower sampling ratio to test setup and options, and then to run it at 1:1 ratio for a final result.
The Use .SML classes checkbox is provided for use with classified images produced by sarscape™ software. Otherwise, class descriptions can be read and saved from a CSV-formatted file as described in the next section below.
Area Calculation
The Calculate button starts the process of area calculation. Depending on the area involved and the sampling ratio, this may take several minutes. Once it is completed, the Legend and Table buttons are fully usable. The Legend button can be used before calculation, as described below, but will not show the relative areas of the raster classes. The Table button is disabled until calculation is done.
The Legend/Classification Tool
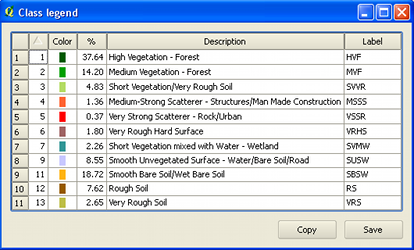 Clicking on the Legend button brings up the window shown at the left. This gives in the left hand columns the code values in the paletted raster, and their corresponding descriptions and short labels (used as headings in the Table tool). The descriptions and labels can be edited. The column headed % shows the percentage of area in each class within the area of interest defined by the FMU vector file. If sample ratio is not 1:1, these area figures are estimates. Clicking on a column heading will sort the column into ascending or descending order. The colour column is however not sortable.
The Save button will save the legend to a file with the same name and file path as the raster layer, but with the extension .FLG (FMT Legend). This is in fact a CSV file of simple structure, and can be edited with a text editor or spreadsheet such as MS Excel or Open Office. In the CSV file, colours are represented as standard 6-character RGB hex strings. Although these can be edited in the text file, this will not affect the colouring of the raster layer, and any edits to the colour codes will be overwritten with the correct ones from the raster palette. The QGIS Symbology tools can be used to change the raster colour palette if required.
The Copy button copies the legend data to the clipboard in an Excel-friendly CSV format. This can be pasted directly into Excel.
Area Table Usage
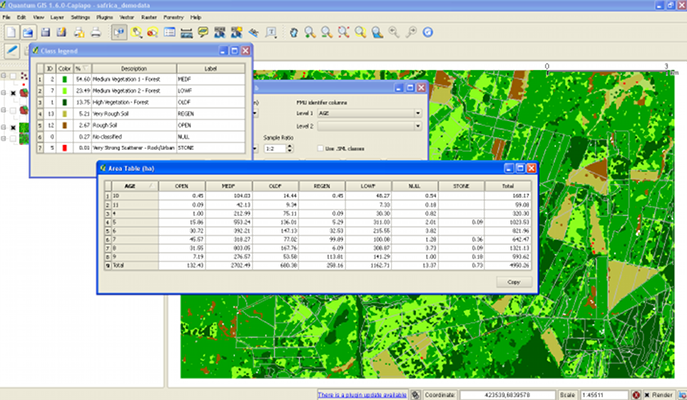 The Table button will bring up a table showing areas in hectares. The table rows are based on the attributes selected in the FMU identifier columns dropdown. In the example shown, stand age is used as a characteristic, but it could equally be forest type, species, compartment numbers, districts, etc., depending on what is available in the attributes of the shapefile. If no FMU identifiers are selected, the table will have only one row, which will be Total values for the whole area of the FMU polygons.
The columns in the table correspond to the labels in the Legend tool. If two or more raster classes are given the same label, then they will be grouped in the area table as a single column. However, when the Legend tool is edited, the change should be saved, the current Table window closed, and the Calculate function re-executed for any changes either in column labels, or FMU identifier selection to be seen on the output table.
The Copy button copies the area table data to the clipboard in an Excel-friendly CSV format. This can be pasted directly into Excel, including table headings. Only selected cells are copied. Click at the top-left of the table to select the whole table.
Planned developments of the FMT
Version 1 of the FMT is a first release with basic functionality for the measurement of forest management areas on classifed satellite imagery or products. Several further tools will be added to this over the coming months, including:
- Sample plot data and forest inventory: This module will allow the input of geo-referenced sample plot data and the calculation of volume, carbon or other allometric derivatives using a stratified sampling calculation with the EO classes as the strata base. The output tables will include sampling error calculation.
- Analysis of unclassified images: Currently, the FMT will only work on classified raster images. A module will be added to allow principle component analysis of multiband data and allow a simple supervised or unsupervised classification to be generated.
- Biophysical regression and 2-phase inventory: This module will allow floating-point files representing SAR HH and HV data produced by, for example, sarscape™ to be correlated with geo-referenced sample plot data and used to calculate forest stock tables of volume, carbon or other stand parameters using 2-phase regression sampling methods.
- Change monitoring: This module will compare area changes by classes between successive images, and allow focus on forest loss within areas defined by protected areas or buffer zones.
Reporting software issues
Please report software problems and suggestions for improvments via the Forum page. Information about solutions and updated versions will also be posted there. Whenever QGIS notifies of the availability of an updated version of the FMT plugin, it is recommended that this be downloaded and installed.